6 Methods to Analyze a Property
Is this property a good buy?
Today I am going to share six methods to help you assess whether a property is a good buy relative to its peers. All six are primarily comparison methods — you select comparable projects, then analyse:
- Normalisation of average PSF (land-cost PSF method)
- Velocity of resale transactions
- Price (average PSF) trend analysis
- Average rental yield analysis
- Rentability analysis
- Rental yield trend analysis
This article focuses on project-level assessment. Unit-level factors (stack, floor, condition) need a separate pass.
Case study context: Tables and charts below use a Bartley-area walkthrough with ~1Q2018–1Q2020 data. Treat them as a historical illustration of method — not live valuations. Source data for your own work: URA.
Here’s the kind of question that starts this process:

The first step is to establish the value of Bartley Ridge against surrounding comparables. For this client case we used Botanique at Bartley, Bartley Residences, Oasis Garden, and The Gazania.
Information typically pulled for analysis:
- Total number of residential units in the project
- Type of tenure and remaining lease (preferably lease start year, not only TOP)
- Average resale transacted PSF for the past two years
- Average rental yield of the past two years
- Number of resale transactions in the past two years
- Number of rental transactions in the past two years
Two years of data is a practical window: recent enough to be relevant, long enough for usable sample size.
General project information
For this case we zoom into 2-bedroom data where possible.
| Project | Total residential units | Total 2-bedrooms | Tenure | TOP year |
|---|---|---|---|---|
| The Gazania | 250 | 80 | Freehold | 2022 |
| Botanique at Bartley | 797 | 382 | 99 years from 2014 | 2019 |
| Bartley Ridge | 868 | 272 | 99 years from 2012 | 2016 |
| Bartley Residences | 702 | 228 | 99 years from 2011 | 2015 |
| Oasis Garden | 134 | 36 | Freehold | 2009 |
Resale information
Average PSF and resale volume for 2-bedroom units (approx. 2018Q1–2020Q1):
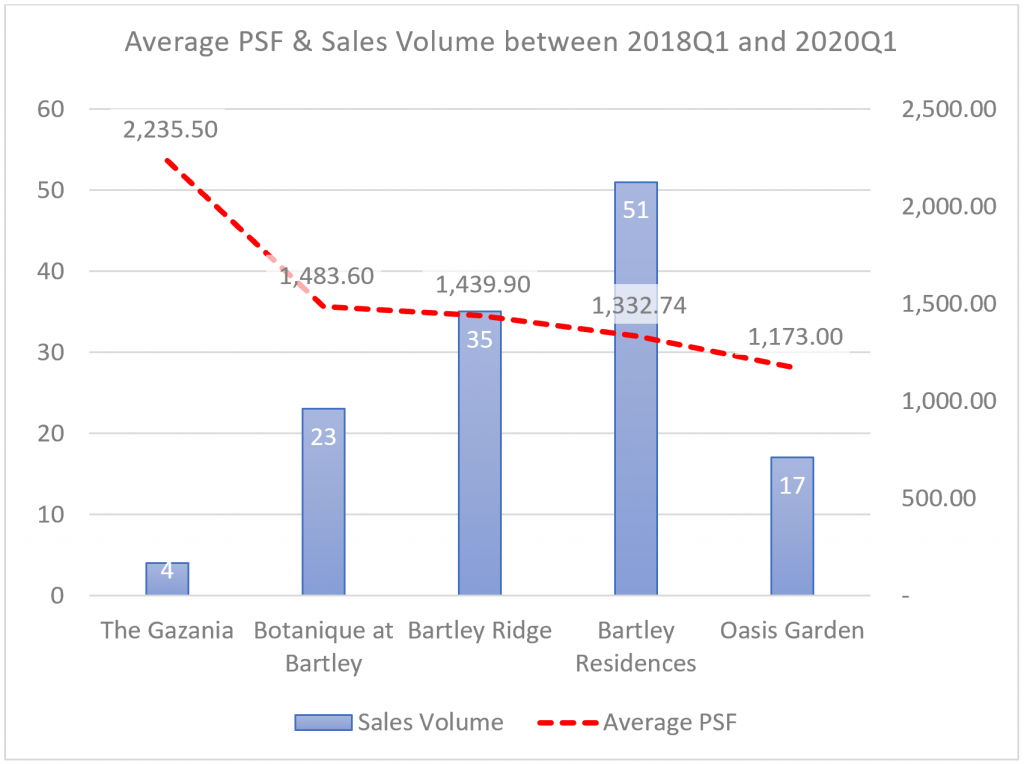
With resale information in hand, we can start comparing Bartley Ridge’s 2-bedrooms against peers.
1. Normalisation of average PSF (land-cost PSF method)
One way to compare projects of different ages is to normalise average PSF toward a common remaining-lease base (often described as a land-cost PSF method). The idea is to “reset” projects of different ages to a comparable lease horizon.
Normalising for leasehold: take average PSF, divide by remaining lease years, multiply by 99:
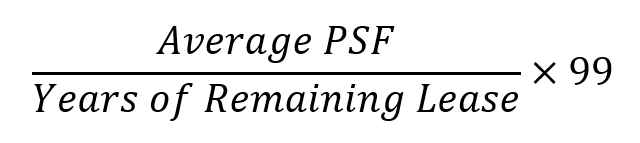
In words:
Normalised PSF ≈ (Average PSF ÷ Remaining lease years) × 99
For freehold, the original method used building age as the proxy instead of remaining lease.
After normalising the five projects:
| Project | Remaining lease (yrs) | Average PSF | Normalised to 99 years |
|---|---|---|---|
| The Gazania | 101 | 2,235.50 | 2,191.23 |
| Botanique at Bartley | 93 | 1,483.60 | 1,579.32 |
| Bartley Ridge | 91 | 1,439.90 | 1,566.48 |
| Bartley Residences | 90 | 1,332.74 | 1,466.01 |
| Oasis Garden | 88 | 1,173.00 | 1,319.63 |
Among the Bartley series (Botanique, Bartley Ridge, Bartley Residences), Bartley Residences looks the better buy on normalised PSF — roughly 7.7% and 6.9% below Botanique and Bartley Ridge respectively after normalisation.
Among all five, Oasis Garden shows the largest normalised discount (~11% vs Bartley Residences) and is freehold. Earlier work on freehold vs leasehold capital appreciation still belongs in the decision — newness, facilities, MRT distance, and product type can outweigh a neat percentage gap.
2. Velocity of resale transactions
Velocity helps assess how easily a unit might sell: higher resale volume relative to stock often signals stronger market interest (with caveats for forced sales and mix).
| Project | Total 2-bedrooms | Resale volume (1Q2018–1Q2020) | Velocity |
|---|---|---|---|
| The Gazania | 80 | 4 | 0.05 |
| Botanique at Bartley | 382 | 23 | 0.06 |
| Bartley Ridge | 272 | 35 | 0.13 |
| Bartley Residences | 228 | 51 | 0.22 |
| Oasis Garden | 36 | 17 | 0.47 |
Oasis Garden shows the highest 2-bed turnover relative to stock. In the Bartley series, Bartley Residences stands out (about 22 resales per 100 two-beds vs 13 and 6 for Bartley Ridge and Botanique).
Velocity here aligned with the land-cost PSF read: better relative pricing correlated with stronger resale activity.
3. Price (average PSF) trend
Price-trend charts show how each project behaved around market events and TOP:
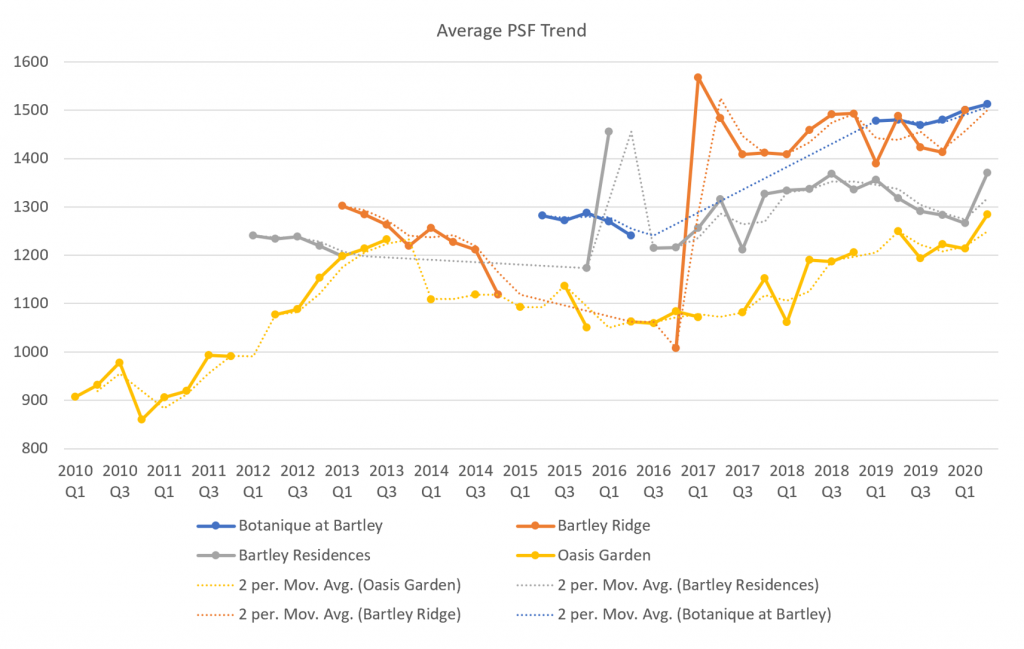
In the original read:
- Oasis Garden showed steadier long-run capital appreciation
- Botanique at Bartley was still in a growth phase at the time
- Bartley Ridge / Residences needed finer (monthly / unit-level) cuts for a clean trend call
Side note: average PSF can jump around TOP as unit mix shifts (e.g. larger 2-beds late in the book can pull PSF down). Always check which units traded in a period before over-interpreting a line.
Rental information
Gross rental yield and rental volume (approx. 1Q2019–1Q2020). The Gazania was excluded while under construction.
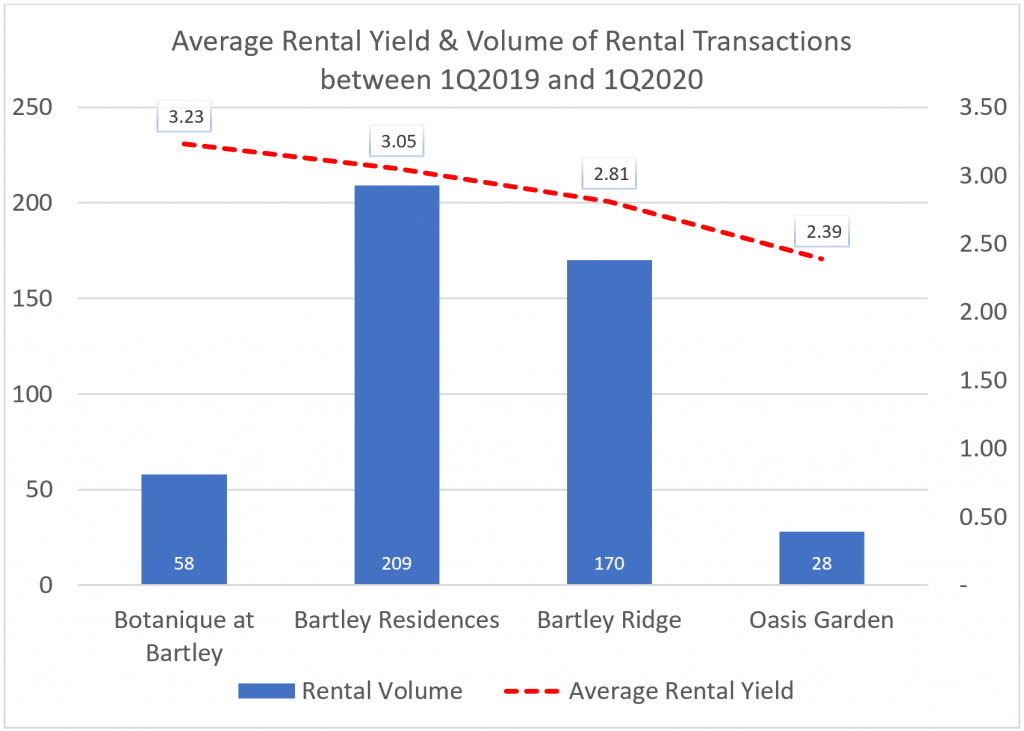
4. Average rental yield
Higher gross yield can improve income return — but may trade off against vacancy (next section).
In this cut: Botanique at Bartley ~3.23%, Bartley Residences ~3.05%, Bartley Ridge ~2.81%, Oasis Garden ~2.39%.
5. Rentability
Rentability ≈ rental transactions ÷ stock of that unit type — a proxy for how easily a tenant is found.

| Project | Total 2-bedrooms | Rental volume | Rentability |
|---|---|---|---|
| Botanique at Bartley | 382 | 58 | 15.2% |
| Bartley Residences | 272 | 209 | 76.8% |
| Bartley Ridge | 228 | 170 | 74.6% |
| Oasis Garden | 36 | 28 | 77.8% |
Botanique’s higher yield sat next to much lower rentability. High yield with low rentability can mean long vacancy — time is an opportunity cost. Limitation: we usually do not know owner-occupier vs pure investment stock, so treat large gaps as a prompt to dig deeper, not as proof alone.
6. Rental yield trend
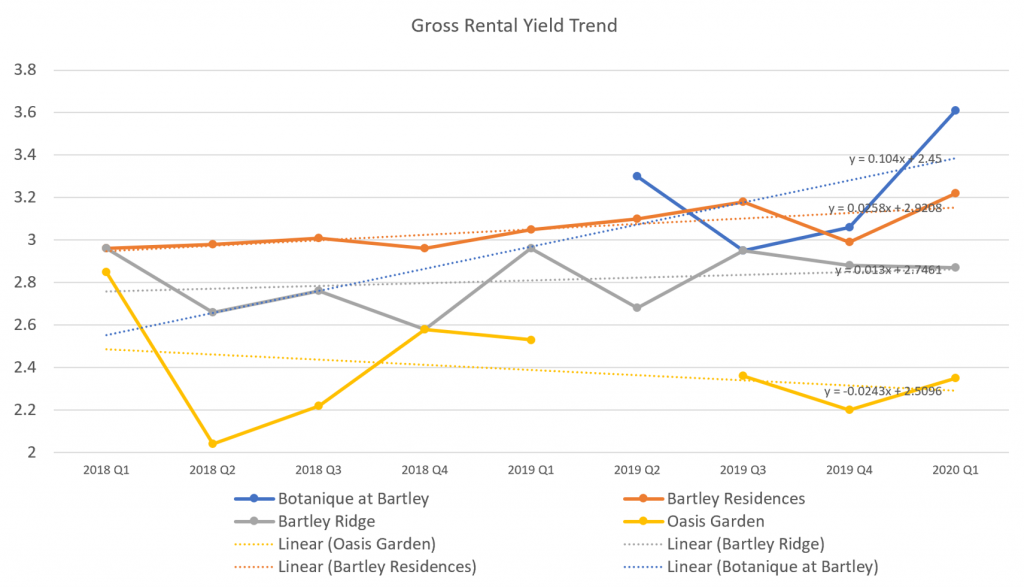
Between Q1 2018 and Q1 2020, the three completed peers’ yields moved differently. In the original read, Bartley Residences looked more attractive for tenants by Q1 2020 (~3.22% vs ~2.87% Bartley Ridge and ~2.35% Oasis Garden). Use consistent yield definitions when you rebuild this chart for a live shortlist.
Wrapping up
| If you care most about… | Lean on… |
|---|---|
| Relative capital value vs peers | Methods 1 + 3 |
| Exit liquidity | Method 2 |
| Income | Methods 4 + 5 + 6 |
| Own-stay comfort | Methods still help — do not over-optimise yield |
Each method has strengths and weaknesses. For own stay, living comfort should not be over-compromised for a neat “best value” cell. For investment, yield without rentability is a trap; cheap normalised PSF without velocity can be one too.
See also
- Market tides — when cycle context matters before you shortlist
- HDB upgrade paths — structure the buy before comparing projects
- LTV & tenure — financing limits that cap what you can pursue
If you want this framework applied to a specific project or unit type, send the brief on WhatsApp — we write the comparison so you can revisit it.